Examples
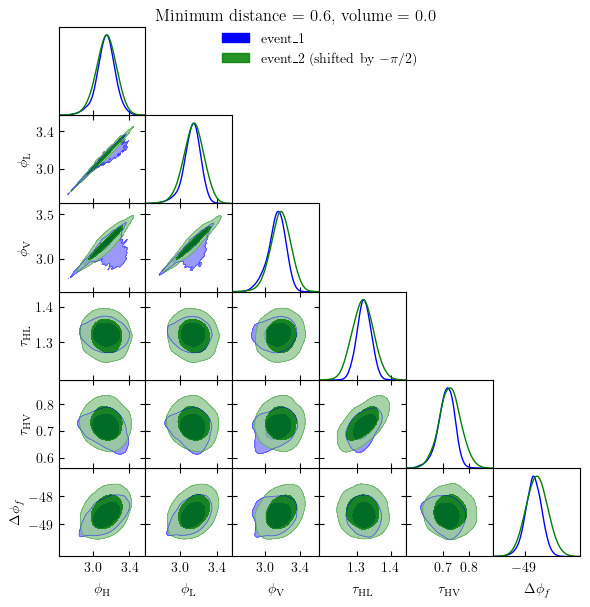
Example 1: a type-I and a type-II lensed GW signals from the same binary black hole (BBH) merger
Note
Before running this example, please make sure that you have pulled the data files
examples/event_1_PE_samples.json
examples/event_2_PE_samples.hdf5
from our github repository using git lfs. Once you have git-lfs installed,
you can do this by running
$ git lfs pull
in the root directory of the repository.
First, we import the two main functions of the package, phazap() and postprocess_phase().
from phazap import phazap, postprocess_phase
We invoke the function postprocess_phase() to compute all the relevant phases from the set of posterior samples associated to the first event of the pair
postprocessed_event_1 = postprocess_phase(
    "event_1_PE_samples.json",
    superevent_name="event_1",
    output_dir="./"
)
03:29 phazap INFO    : Detectors online ['H1', 'L1', 'V1']
03:29 phazap INFO    : Waveform approximant IMRPhenomXPHM
03:29 bilby INFO    : Waveform generator initiated with
  frequency_domain_source_model: bilby.gw.source.lal_binary_black_hole
  time_domain_source_model: None
  parameter_conversion: bilby.gw.conversion.convert_to_lal_binary_black_hole_parameters
100%|██████████| 20000/20000 [00:40<00:00, 493.00it/s]
03:30 phazap INFO    : Assigning None as the label
03:30 phazap INFO    : Postprocessing completed and saved to ./phases_event_1_fbest_40.0_fhigh_100.0_flow_20.0.hdf5
Then we do the same for the second event of the pair. Notice that the function postprocess_phase() can handle both json and hdf5 files as input.
postprocessed_event_2 = postprocess_phase(
    "event_2_PE_samples.hdf5",
    superevent_name="event_2",
    output_dir="./"
)
03:30 phazap INFO    : Detectors online ['H1', 'L1', 'V1']
03:30 phazap INFO    : Waveform approximant IMRPhenomXPHM
03:30 bilby INFO    : Waveform generator initiated with
  frequency_domain_source_model: bilby.gw.source.lal_binary_black_hole
  time_domain_source_model: None
  parameter_conversion: bilby.gw.conversion.convert_to_lal_binary_black_hole_parameters
100%|██████████| 37783/37783 [00:51<00:00, 737.66it/s]
03:31 phazap INFO    : Assigning None as the label
03:31 phazap INFO    : Postprocessing completed and saved to ./phases_event_2_fbest_40.0_fhigh_100.0_flow_20.0.hdf5
Once we have postprocessed both events, we can invoke phazap() to compute the \(D_J\) statistic (the first output) and the associated \(p\)-value (the fifth output) of the pair with a specific phase shift (the third output). Refer to the documentation of phazap() for more details.
phazap(postprocessed_event_1, postprocessed_event_2)
(0.5972052069812863,
 0.00021390501494614994,
 -1.5707963267948966,
 array([ 11.63033625, 116.76706481,  11.50064831,   0.59720521]),
 0.002853245896191292)
The best-fit phase shift is \(-\pi/2\), with a distance \(D_J \approx 0.597\sigma\) and a \(p\)-value of \(0.0002\). Therefore, according to our analysis, this pair is consistent with being a pair of type-I-type-II lensed GW signals.
We can also make a plot visualizing the result with phazap.plot_utils.phazap_plot()
from phazap.plot_utils import phazap_plot
fig = phazap_plot(
    postprocessed_event_1,
    postprocessed_event_2,
)
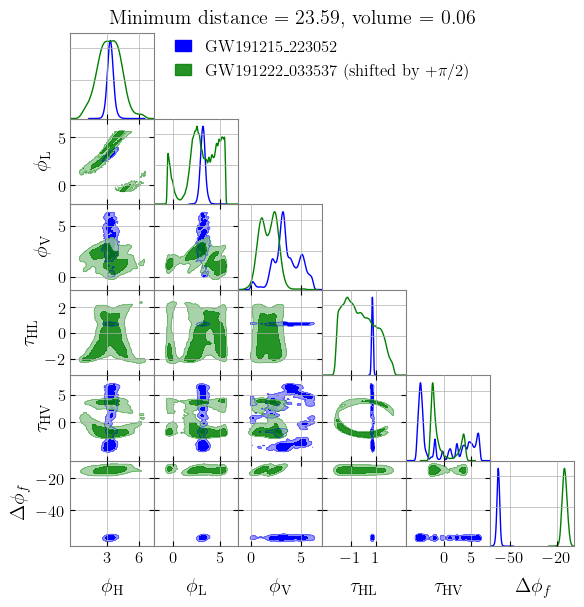
Example 2: analyzing GW191215_223052 and GW191222_033537 from GWTC-3 public data release
Note
Before running this example, please make sure that you have downloaded the PE data release files associated to these two events from Zenodo.
Alternatively you can download them from the terminal using wget
$ wget https://zenodo.org/records/8177023/files/IGWN-GWTC3p0-v2-GW191215_223052_PEDataRelease_mixed_cosmo.h5
$ wget https://zenodo.org/records/8177023/files/IGWN-GWTC3p0-v2-GW191222_033537_PEDataRelease_mixed_cosmo.h5
In this example, we will be using exactly the same code as above but using the publicly-available PE results instead. Here we choose GW191215_223052 and GW191222_033537 as an example.
from phazap import phazap, postprocess_phase
postprocessed_event_1 = postprocess_phase(
    "IGWN-GWTC3p0-v2-GW191215_223052_PEDataRelease_mixed_cosmo.h5",
    superevent_name="GW191215_223052",
    output_dir="./"
)
Notice that we are using exactly the same interface as before, but now the input file is a PESummary metadata file.
06:38 phazap INFO    : Detectors online ['H1', 'L1', 'V1']
06:38 phazap INFO    : Waveform approximant IMRPhenomXPHM
06:38 bilby INFO    : Waveform generator initiated with
  frequency_domain_source_model: bilby.gw.source.lal_binary_black_hole
  time_domain_source_model: None
  parameter_conversion: bilby.gw.conversion.convert_to_lal_binary_black_hole_parameters
100%|██████████| 6913/6913 [00:25<00:00, 272.43it/s]
06:38 phazap INFO    : Assigning None as the label
06:38 phazap INFO    : Postprocessing completed and saved to ./phases_GW191215_223052_fbest_40.0_fhigh_100.0_flow_20.0.hdf5
postprocessed_event_2 = postprocess_phase(
    "IGWN-GWTC3p0-v2-GW191222_033537_PEDataRelease_mixed_cosmo.h5",
    superevent_name="GW191222_033537",
    output_dir="./"
)
06:38 phazap INFO    : Detectors online ['H1', 'L1']
06:38 phazap INFO    : Waveform approximant IMRPhenomXPHM
06:38 bilby INFO    : Waveform generator initiated with
  frequency_domain_source_model: bilby.gw.source.lal_binary_black_hole
  time_domain_source_model: None
  parameter_conversion: bilby.gw.conversion.convert_to_lal_binary_black_hole_parameters
100%|██████████| 26560/26560 [01:24<00:00, 313.89it/s]
06:40 phazap INFO    : Assigning None as the label
06:40 phazap INFO    : Postprocessing completed and saved to ./phases_GW191222_033537_fbest_40.0_fhigh_100.0_flow_20.0.hdf5
phazap(postprocessed_event_1, postprocessed_event_2)
(25.250061987532753,
 0.19916690028571304,
 3.141592653589793,
 array([25.67560006, 25.82643826, 25.25006199, 25.5637582 ]),
 0.999999999999999)
The best-fit phase shift is \(+\pi\), with a distance \(D_J \approx 25.3\sigma\) and a \(p\)-value of basically \(1\). Therefore, according to our analysis, this pair is inconsistent with being a pair of strongly lensed GW signals of the same source.
Similarly, we can make a plot visualizing the result
from phazap.plot_utils import phazap_plot
fig = phazap_plot(
    postprocessed_event_1,
    postprocessed_event_2,
)